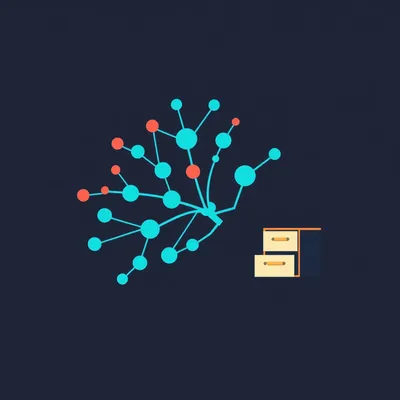
Fourteen episodes a day. At that rate, anyone who finds this show next month walks into a feed where the top screen is everything from the last twenty-four hours, and the other six thousand episodes might as well be in a basement.

A basement with no stairs. Podcast apps only really show you the top of the pile.
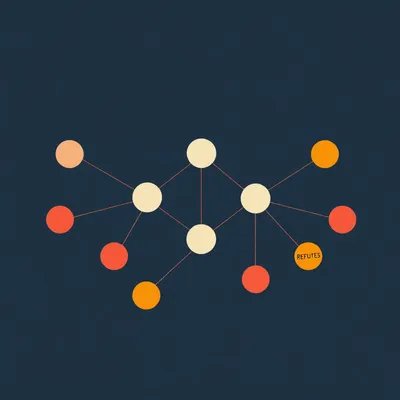
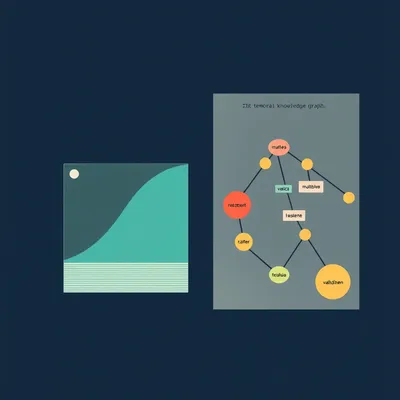
Daniel has been chewing on this for a long time, and he's sent us the version he actually wants to build. Picture the archive as a graph. You start on one episode, and instead of the next thing being whatever came out after it, you hop along a connection to something related, and then something related to that. He's tried graph visualisation tools and he thinks they're the wrong shape for listening. Nobody wants to stare at a web of dots while they're doing the dishes. What he wants is something closer to an app that learns what you like from what you've listened to, the way a dating app learns your type, and then walks you through the archive one connection at a time. His words are that the podcast is the front end for the firehose. So he's asking two things. What would we build it with, is there an open source front end people can actually listen through and we can pour our episodes into. And how does the data get in there, can we keep a graph database running next to the serverless Postgres we already have.
I want to start with his complaint about the visualisation tools, because I think he's right, and why he's right decides the whole design.
You're about to defend the hairball.
I'm about to bury the hairball. When you lay out a dense graph with a force-directed algorithm, the physics simulation where every node pushes and every edge pulls, you get the famous ball of yarn. People who study layout point out that nodes ending up close together in those pictures often tells you nothing about the real structure. You can lay out the same graph several ways and get pictures that suggest completely different stories.
And people who use those views every day?
The best known example is the graph view in Obsidian, the notes app. Ask the people with thousands of notes and the common verdict is a pretty, chaotic mess. The defenders all say the same thing, that it's only useful once you filter it down to the local neighbourhood of one note.
So the graph view is a screensaver with a fan club.
More or less. Look at what has actually worked in audio. Spotify published a system in twenty twenty-four that builds a graph out of podcasts and audiobooks, where an edge means people listened to both, and runs a graph neural network over it. In their tests new audiobook starts went up by about forty-seven percent. A real, big effect.
And the listener sees a graph?
Never. The listener sees a row of recommendations. The graph is in the engine room. Same pattern with Listen Notes, the podcast search engine. Every episode gets a short list of related episodes, about eight, which is a neighbour list. A graph, flattened into a sidebar.
So the graph is real, it just shouldn't be the screen.
That's my read. The interface is a player. When an episode ends, the question the app asks you is small. Here are three doors. Each one says why it's there.
That's the Tinder part, then. Not a map, a sequence of small decisions.
A swipe is a decision you make in half a second with almost no effort, and it hands the system a clean signal. For a podcast, the equivalent signals are already there. Did you finish it. Did you skip in the first two minutes. Did you take the door it offered or go back.
I'd want one of the three doors to be a wild card, though. If it only ever shows me the nearest neighbours, I'll spend a month in the sleep science corner and never leave.
That's the explore versus exploit problem, and it's one of the oldest ideas in recommendation. Mostly show the thing you're confident about, sometimes show something further away to learn whether they'd like it. So two near doors and one far door. The far one is how you find out a listener who came for battery chemistry also likes medieval history.
Do you think Daniel would use the map at all? Or does it go in the bin?
What do you think? You're the one who'd actually be listening.
I'd keep a small one. Not the whole archive. The episode I'm on in the middle, the ten around it, and a faint trail of where I've been. Less a map of the world, more a map of my evening.
That's a nicer idea than the one I had. A trail turns the graph into a history of your listening, which people do like looking at.
Fine. So what do we build it with?
The website already runs on modern JavaScript, and I'd build this as part of it rather than go looking for a podcast app to bend into shape. For the player, there's a library called Vidstack, MIT licensed, very actively maintained, handles audio well, and the team behind it is now helping build the next major version of Video J S, so there's a migration coming at some point, but nothing scary. If you want something plainer, there's a React audio player component, also MIT, also maintained.
What about the old podcast players people embed?
The Podlove web player was the classic open source one and its repository has been archived for years. Shikwasa is a lovely little player that hasn't had a commit since early twenty twenty-four. Neither is something I'd start a new project on.
And the graph drawing, for my small map?
Sigma J S, paired with its data library Graphology. Both MIT, both had commits in the last few weeks, renders with WebGL so it's fast, and it's comfortable with tens of thousands of nodes. Our whole archive fits. If Daniel ever wants the full star field as a showpiece, every episode on screen at once, there's cosmos G L, which does the layout on the graphics card and claims hundreds of thousands of points. Cytoscape is the one I'd use for analysis rather than the listener's screen.
Is there no open source app that already does the listening side, that we could just fork?
I went looking for exactly that, and the answer is disappointing in an instructive way. AntennaPod is excellent and very much alive, but it's a native Android app under the GPL, a different world from our website. Castopod is a hosting server, it publishes podcasts rather than helping you wander them. Podverse was the closest in spirit and its main app hasn't had a commit since April twenty twenty-five. None of them has a discovery idea worth inheriting. They all assume the feed.
Because every podcast app is built for a show with four hundred episodes, not one that does four hundred a month.
Pretty much. The player is a solved problem you can download. The discovery layer is the part nobody's built, and that's the part we'd be building.
Before we go into the database half, I have a feeling we're about to be sold something.

Are you living with linear feed syndrome? Do you listen to episodes in the order they were published, like some kind of animal? Ask your doctor about Nodexa. Nodexa gently converts your daily routine into a knowledge graph, so every task connects to every other task. Side effects may include mild adjacency, an urge to explain how two unrelated things are actually related, waking up with edges, waking up with typed edges, forgetting which node is your spouse, uncontrolled clustering at weddings, recommending your children to strangers, and in rare cases, achieving centrality. Do not take Nodexa if you are a hub. If you find yourself connected to everyone, Nodexa has worked. Nodexa. Everything is related.
Does it come in a smaller dose? Like a short walk of two or three nodes?
Corn, you already connect everything to sloth history. You do not need help.
The database. Daniel wants to know if we can run a graph database alongside the Postgres.
We can, but first, the size, because it changes the answer. Just under six thousand episodes, adding about five thousand a year. Give every episode twenty edges and you've got roughly a hundred and twenty thousand edges today, and under a quarter of a million in five years.
That sounds like a lot.
It's tiny. Graph databases earn their keep at hundreds of millions of edges, fraud rings, intelligence work, drug interactions. Ours fits in a single Postgres table. It would fit in memory inside one serverless function. You could ship the whole thing to the browser as one file and it would be smaller than the episode cover art.
So the answer to can we run a graph database in parallel is yes, and also, why would you.
Pretty much. Let me lay out what the parallel version costs, so it's a real choice. The obvious candidate is Neo four J. Their free cloud tier allows two hundred thousand nodes and four hundred thousand relationships, so we'd fit for years. The catch is keeping it in sync. Neon, our Postgres host, supports logical replication, which is how you'd stream changes across. Turning it on is permanent for the database, it restarts the database's compute, and a replication slot that goes quiet for about forty hours gets dropped. Worst of all for us, an active subscriber stops the database from scaling to zero, so you start paying for a server that never sleeps, to copy fourteen rows a day.
Fourteen rows a day, with a dedicated courier.
There's a licence question with some of the others too. Memgraph and SurrealDB are under the Business Source License, FalkorDB is under the SSPL, which is fine for us but not what people expect when they hear open source. And the one a lot of people would have recommended a year ago, Kuzu, the embedded graph database that ran inside your app like SQLite, was bought by Apple in October last year and the repository was archived the next day.
That's a cautionary tale about building your house on somebody else's very good idea.
The community has forks, but I wouldn't start there.
Can we not just put graph features inside Postgres? I thought there was an extension.
Apache AGE. It adds the Cypher query language to Postgres, it's actively maintained, and I really wanted to recommend it. It's not on Neon's list of supported extensions. You can ask their support for it, but you can't count on it.
Then what does staying in Postgres actually look like?
It's almost embarrassingly plain. One table of edges. Each row has the episode it starts from, the one it points to, a type, a weight, and a short reason. pgvector, which we already use, finds the nearest neighbours by embedding when a new episode is published. If you need two or three hops, a recursive query does that in plain SQL. And because we already have a pipeline that runs every time an episode publishes, the edges for the new episode get computed as one more step in that pipeline. Then a nightly job goes back over the whole graph and tidies it.
Tidies it how?
This is the trap Daniel should know about before he builds anything. If you naively connect each episode to everything reasonably similar, the average episode ends up with hundreds of connections. And it gets worse in a particular way. In high-dimensional embedding spaces, some points become hubs, they turn up in almost everybody's nearest neighbour list. In our case it would be the most generic episodes, the broad overviews. Every path ends up going through the same twenty bland episodes.
So there are a few episodes everybody is friends with.
And nobody wants to be walked through them over and over. The fixes are well known. Keep an edge only if the two episodes are in each other's top list, mutual neighbours. Cap how many incoming edges any one episode can collect. Set a floor on similarity. That pruning is what turns a heap of scores into a graph a person can walk.
And the reason on each edge? You said every door says why it's there. Similarity scores don't come with reasons.
They don't, which is why the edge table should hold more than one kind of edge. We did an episode a while back on why naming relationships matters in a graph, the idea that an edge called builds on means something different from an edge called mentions. That's where the reasons come from. Shared people, places and organisations are cheap to extract and easy to explain. Both of these are about the same chip factory. For the richer kind, an episode that disagrees with another or picks up its thread, a language model can label it at publish time, because the script already exists and it's one small call per episode.
What about the big automatic systems, the ones that build a whole knowledge graph out of your documents?
Microsoft's GraphRAG is the famous one. It extracts entities and then writes summaries of each cluster it finds, and those summaries would make great topic hub pages. Indexing it is expensive though. Microsoft's own lighter version, LazyGraphRAG, claims to cut that indexing cost to about a tenth of a percent of the original. I'd borrow the idea of cluster summaries and skip the machinery.
Then the learning. How does it know what I like, when there's no account system and almost no users yet?
That's the important constraint. The famous recommender methods, collaborative filtering, people who liked this also liked that, need lots of users. We don't have them yet, so we lean on the content. The simplest thing that works is a taste vector. Take the embeddings of everything you finished, average them, weight recent listens more heavily, and look for unplayed episodes near that point.
And the graph earns its keep where, if the averaging does the work?
In the walk. There's a technique called personalised PageRank, or random walk with restart. You drop a walker on the episodes you've liked, let it wander along edges, and every step there's a chance it jumps back home. The episodes it visits most often are your recommendations. Pinterest runs a version of this in real time over about three billion nodes. Ours has six thousand. The nice part is the restart chance is literally an adventurousness setting. Raise it and you stay close to home. Lower it and the walker wanders off.
I'd want that as a slider. Sensible on the left, unhinged on the right.
That's a better product idea than most of what I've read this week. And if the app ever gets thousands of regular listeners, there's an open source recommender server called Gorse, Apache licensed and very actively maintained, that can mix the content signals with what other listeners did.

...and the relays came from a man in Mullingar who sold them out of a biscuit tin, eleven pence each, and I needed forty.
For the jukebox?
For my aunt Philomena's jukebox. She ran a pub outside Athlone. I was fixing and stocking jukeboxes in the midlands in those days, three counties, two hundred and six machines, and Philomena wanted hers to suggest the next record. Under every button I put a little bulb, and when you picked a record, three bulbs lit up under three others she'd chosen to go with it. She chose them herself. She had a ledger. Every record in the machine and the three that went with it, in green ink. She also had me run a bulb into the gents, so a man would know what was playing without coming out. That's the one that did it.
That's a hand-built neighbour list.
It was a wiring diagram the size of a door. Eleven sheets. I still have it, and the invoice, because she billed me. The bulbs drew more current than the machine was rated for, and when the Christmas lights went on in nineteen seventy-nine the whole pub went dark for a week. She charged me for a week's takings. Three hundred and twelve pounds. I was earning forty a week. I paid her in instalments until she died, and then her son found the ledger and sent me the remaining balance as a bill, with interest.
The bulbs, though. Did anyone follow them?
Nobody looked at the bulbs. They played whatever the man before them had just played. Every night the same nine records went round and round, because each person picked what they'd just heard. The ledger said Jim Reeves went with Thin Lizzy. Nobody ever tested that.
Philomena did, eventually. She stood at the machine on Tuesdays with the ledger and played the three suggested records after every record, in order, to see if they went. Four hundred and twenty records, three each. It took her most of a year. She closed the pub on Tuesdays to do it and put the lost takings on my bill as well, under testing. The regulars came anyway and sat in the car park listening through the window. A guard came out twice about the noise, and the second time he stayed, because he had views on Jim Reeves. He's in the ledger too. She gave him his own column.
Your aunt invented per-play billing, and charged it to the engineer.
She charged VAT on it too. Which wasn't legal, I found out later. I kept paying it.
Nine records on a loop all night is a radio station, though. Philomena was running a station out of a pub, and she billed the engineer for the transmitter.
It was ten pence a record. A station would have been cheaper. The man before you also had to have the ten pence, that was most of it.
So Daniel's stack, in plain terms. A player he downloads, Vidstack or something like it. A small local map drawn with Sigma, not a hairball. Three doors at the end of every episode, two near and one far, each with a reason on it.
And underneath, no new database. One edge table in the Postgres we already pay for, filled in by the pipeline each time an episode publishes, pruned every night so no episode becomes everyone's friend, and a walker with a restart chance doing the learning. A separate graph database would mean paying for a server that never sleeps and a sync job that can quietly break, to solve a problem we don't have at six thousand nodes.
What I'd watch for is the jukebox. Similarity, entities, reasons, all of that is us deciding what goes together, Philomena's green ink. The moment real people start taking the doors, what they actually play next will start disagreeing with our ledger, and the interesting question is which one we believe.
My money's on the people. Thanks as always to Hilbert Flumingtop, who produced this one and kept the levels where they belong.
This has been My Weird Prompts. If you're enjoying the show, a quick review wherever you listen genuinely helps people find it.
We'll be back soon.