So Daniel sent us this one. He's been thinking about the podcast's own production pipeline, which is a fair bit of code and agents at this point. His core question is about the evaluation problem. When you make a single, incremental change to a complex agentic pipeline—like swapping out a search API, tweaking some grounding logic, or trying a new agent harness—how do you know if it actually made things better? The current method is essentially 'try-and-see': run several full episodes, listen to them, and try to gauge the impact. That's slow, expensive in compute, and incredibly noisy. He's proposing a more systematic, engineering-driven approach. Define deterministic checkpoints in your pipeline, and use evaluation platforms to test up to those points, so you can attribute performance changes precisely to the component you changed. He wants us to dig into the tools, the checkpoint definition, and the observability solutions that make this practical.

This is such a critical pain point that most teams just accept as the cost of doing business. A Stanford CRFM study from last year found that iterative 'try-and-see' testing of multi-agent systems can consume over seventy percent of a project's initial compute budget. You burn through credits just trying to figure out if your tweak did anything.
Which is madness. It's the opposite of engineering. You wouldn't change a single function in a traditional software project and then have to deploy the entire monolithic application to production and wait for user reports to see if it worked. You'd write a unit test.
Right. And that's the mental shift. We need to start treating our AI pipelines not as magical, end-to-end black boxes, but as a series of connected, testable components. Each stage—retrieval, grounding, planning, generation—should have a defined interface and a way to evaluate its output in isolation. By the way, today's episode is being written by DeepSeek V3.2 (chat). Fitting, given the topic.
A little meta. But it underscores the point. Our own pipeline has a grounding stage that does web search, checks Pinecone, and consults the episode memory. If Daniel wanted to swap from Tavily to Exa AI for that search, the old way would be to run a few episodes and see if the scripts feel more accurate or relevant. The new way, the engineering way, is to define a checkpoint right after the grounding stage. You capture its output—a structured bundle of context, sources, citations—and you evaluate that against a set of test prompts, before a single token of the script is written.
And you can do that evaluation with a fraction of the compute, and get results in minutes, not days. The goal is precise attribution: favorable, neutral, or degraded. So, if 'try-and-see' is broken, what's the fix? It starts by treating your pipeline not as a magic box, but as a series of connected, testable components.
And that fix is a two-part methodology. First, you define those deterministic checkpoints. You decide where in your pipeline you can press pause and say, 'This stage is done, here is its output artifact.' Second, you use an evaluation platform that can run your pipeline up to that point and give you a score, a side-by-side comparison, something quantifiable.
And the goal is to move from this fuzzy, holistic 'feels better' judgment to a precise attribution of impact. Did switching the search API improve the relevance of the retrieved context by fifteen percent? Did it degrade citation accuracy? Was it neutral on factual recall but cut latency in half? Those are the kinds of questions this approach lets you answer.
Which gets at what this is really about. It's about applying software engineering rigor to probabilistic systems. We accept that LLMs are stochastic, but we've been using that as an excuse to treat the entire pipeline as untestable. We're saying you can introduce determinism at the boundaries between stages. The checkpoint is a contract.
No, sorry, force of habit. The checkpoint is a contract. It says, 'Given this input and this configuration, this stage promises to produce an output that meets certain criteria.' The evaluation platform is how you verify that contract is being upheld, especially after a change. The confounding variables you mentioned, Corn, they come from letting changes in early stages ripple through later stochastic stages. If your grounding gets worse but your writing agent gets lucky and compensates, you might think the pipeline improved. That's noise.
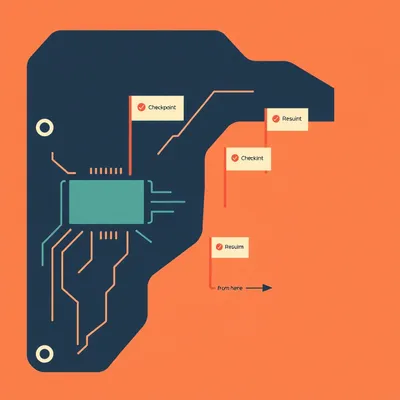
So we isolate the variable. Test the grounding stage output directly. That means we need to be very deliberate about what a checkpoint actually is, technically. It's not just a log statement. It's a snapshot of the entire state at that point in the DAG.
Right. It has to include the input prompt, the configuration or system prompt for that stage, the output artifact itself—which could be a JSON object, a list, a structured text—and metadata like latency, token usage, and cost. With that snapshot, you can replay it, evaluate it, and compare it to another snapshot from a different version of that stage.
And once you have that foundation, the second part—finding the right evaluation platform—becomes a matter of plumbing. How do you get that checkpoint data into a system that can help you make sense of it? That's where the tool landscape gets interesting.
It does. And there's a whole spectrum, from heavyweight enterprise suites to lightweight open-source tools. But they all serve that core function: taking your checkpoint data and helping you judge it, automatically or manually. So the checkpoint itself is the fundamental unit they work with.
Right, and that makes me want to get concrete about what it means to define one. You said it's a snapshot. But how do you actually instrument that in code? If I'm looking at our pipeline, which is a series of Python functions and classes, what am I physically adding?
The mental model is to treat every agent, every transformation, as a pure function. Even though LLMs are probabilistic, the function's interface is deterministic: you give it an input and a configuration, and it produces an output. The checkpoint is the recording of that function call. The most straightforward way is to use decorators. You wrap your stage function with something like @checkpoint that automatically captures everything you need.
So for our research agent, the function might be def research_agent(topic_query, system_prompt): and it returns a context bundle. The decorator would intercept that call, log the input arguments, run the function, capture its return value, time it, count tokens, and then stash that whole package somewhere.
That's the ideal. In practice, you might be using a framework like LangChain or LlamaIndex that has callbacks built in. LangChain's tracing, for instance, is designed for this. You can define a 'run' that ends at a specific step, and LangSmith will capture the entire trace up to that point. But the principle is the same: you need a hook into the execution to grab the data.
What's in the data package, exactly? You mentioned the full snapshot.
It's a schema. You need the input prompt, obviously. You need a snapshot of the configuration—that's the system prompt, any model parameters like temperature, the specific tools enabled for that agent. Then the output artifact. For a grounding stage, that's your structured context bundle: a list of facts, each with a source URL and a snippet. Then metadata: start and end timestamps for latency, input and output token counts from the LLM provider, and the calculated cost.
And you need this to be reproducible. If I run the same test tomorrow, I should get the same data to evaluate, otherwise the comparison is meaningless. How do you handle the randomness of the LLM itself?
That's where deterministic seeding comes in. It's a crucial, often overlooked part. When you're doing development and A/B testing, you should run your LLM calls with a fixed seed. Most API providers support a seed parameter. This means that for a given input and configuration, the model will generate the same output every time. It turns a stochastic call into a deterministic one for testing purposes.
So you're essentially mocking the LLM's randomness.
For evaluation, yes. It lets you isolate the effect of your logic change. If you change your search API from Tavily to Exa, but keep the seed the same, any difference in the output context bundle is due to the different search results and your processing logic, not because the LLM wrote a different summary. Once you've validated the change, you remove the fixed seed for production for diversity.
What's the trade-off? This sounds like more code, more complexity.
The trade-off is upfront engineering complexity versus a massive reduction in evaluation noise and cost. You're adding observability hooks, maybe writing a small checkpointing library or integrating an SDK. But the payoff is that you can run a battery of fifty test prompts through your new grounding logic in an hour, for a few dollars, and get a clear statistical signal on performance. Versus the old way: running fifty full episodes, which might take days and cost hundreds, and then trying to subjectively judge the final script quality.
Why is this necessary in the first place? Why are these pipelines so opaque?
Because they're stateful and non-linear in a way that's hard to introspect. A traditional web service has a request, some database calls, business logic, a response. You can put logs in between. An agentic pipeline has loops, conditional branching, tool calls that can fail and be retried, and each step is an LLM call that's a black box. The internal reasoning isn't exposed. So when a final output is bad, you have to reverse-engineer which stage went wrong. Was the query poorly formulated by the planner? Did retrieval fail? Did the generator ignore good context? Checkpoints give you windows into that process.
So let's use our own pipeline as the case study. After the research agent, we have a checkpoint. What does that output artifact look like, and what would we evaluate about it?
For our show, the research agent's job is to take a topic prompt and return a list of sourced, verifiable facts and relevant citations from our memory system. The output artifact is a JSON list. Each item has a 'fact' field, a 'source_url' field, and a 'confidence' or 'relevance_score'. The checkpoint captures that list. The evaluation wouldn't be about whether the final script is good. It would be about the quality of that list.
And what metrics? You can't just have an LLM judge if it 'feels' right.
You'd define specific, stage-appropriate metrics. For a research checkpoint, you might have: citation accuracy—do the supplied URLs actually support the fact? Context relevance—how closely do the facts align with the query intent? Factual density—is it a list of substantive claims or fluff? You can use an LLM-as-a-judge with a very strict rubric to score those, or you could use more traditional information retrieval metrics. The key is the metric is tied to the stage's purpose, which is to provide accurate, relevant source material.
This is starting to sound like unit tests, but for data structures instead of return values.
That's exactly what they are. Integration tests for your AI pipeline stages. You have a test suite of input prompts. You run your stage, capture the checkpoint, and run your evaluation metrics against it. A diff tool shows you how the scores changed from the last commit. It turns pipeline tuning from alchemy into a measurable engineering discipline.
Right, so with that checkpoint data—a packaged snapshot of a stage's work—the next question is about the tooling. Where does that data actually go to get judged? You mentioned a spectrum.
Right. And the landscape has really matured in the last year or so. We're moving from basic logging to full platforms built for this evaluation workflow. On the heavyweight, enterprise end you have Arize AI. They offer a full suite for monitoring and evaluating LLM applications, with strong features for tracing, evaluation, and drift detection. It's designed for large teams with complex production deployments.
And on the lighter end?
The open-source option that's gained huge traction is Phoenix, also from Arize. It's a Python library for ML observability. You can run it locally or deploy it yourself. The key for our use case is that it has built-in evaluators for RAG and agent tasks—things like relevance, faithfulness, citation accuracy. And it saw a three hundred percent increase in downloads in the first quarter of this year, largely because of new integrations with agentic frameworks.
Three hundred percent? That's not a subtle trend.
It signals the demand. Developers are realizing they need these tools. Then you have the framework-native options. LangSmith is the obvious one if you're using LangChain. It's built for tracing and evaluating LangChain runs. You can define a run tree that stops at a specific step—like our research checkpoint—and LangSmith captures everything. It has side-by-side comparison views and you can set up automated evaluations using LLM judges.
I've seen the LangSmith interface. It does make the trace look like an actual tree you can collapse and expand.
It does. And a competitor in that space is Braintrust. It's another full-stack platform for evaluating and monitoring AI applications. They position themselves as more data-centric, with a strong focus on using your own data to evaluate prompts and models. They also support the concept of "experiments" where you can compare different versions of a pipeline component.
And then there's the old guard from the traditional ML world trying to adapt.
Weights & Biases is the prime example. Their Weave product is their answer for LLM evaluation and monitoring. It's powerful if you're already in their ecosystem for experiment tracking. And for the do-it-yourself crowd, you can build on OpenTelemetry. The OpenTelemetry community has published semantic conventions for GenAI, which provide a standard way to instrument LLM calls, tool calls, and agent steps. You can pipe that data to any OTel-compatible backend.
So how do you choose? If I'm a solo developer trying to improve my podcast pipeline, versus a twenty-person engineering team at a bank?
The trade-offs are about complexity, cost, and control. For a solo developer or a small project, I'd start with Phoenix. It's free, open-source, and you can get it running in an afternoon. You instrument your checkpoint, you feed the output to a Phoenix evaluator, and you get scores and visualizations. The barrier to entry is low.
And for the big team?
For a large team where you need collaboration features, role-based access, audit trails, and enterprise security, a platform like Arize or LangSmith's paid tiers makes sense. They handle the infrastructure, the data persistence, the user management. You're paying for a service.
Let's get concrete with our case study. Say we want to test switching our search API from Tavily to Exa AI. We've instrumented our research agent checkpoint. We have a test suite of fifty topic prompts. How do we use, say, Phoenix to tell us if the change is good?
You'd run your pipeline twice—once with the Tavily integration, once with Exa. For each run, you capture the checkpoint output: that JSON list of facts and citations. You'd then write or use a pre-built Phoenix evaluator to judge the quality of each list. You'd probably want at least two scores: a relevance score, which measures how well the retrieved facts match the query intent, and a citation accuracy score, which checks if the source URLs actually support the stated fact.
And Phoenix can do that automatically?
Yes. You'd use an LLM-as-a-judge, with a very specific rubric, to score each context bundle. Phoenix orchestrates that. Then it gives you a dashboard. You can see the distribution of scores for the fifty prompts on the old version versus the new one. You can see the average relevance went from point seven to point eight five. Or you might see citation accuracy dropped slightly. The side-by-side view is the killer feature. You can click on a low-scoring example and see exactly what facts each version retrieved, and why the judge scored one higher.
So you're not just getting a thumbs up or down. You're getting a detailed, quantitative breakdown of the change's impact on the specific metrics that matter for that stage.
That's the precision this whole methodology enables. You're no longer guessing if the final script 'seems better.' You know that your grounding stage now retrieves more relevant facts with higher citation fidelity. That's a measurable improvement you can attribute directly to the API switch.
What about integration? How do you physically get the data from our Python pipeline into Phoenix or LangSmith?
The patterns are similar across tools. For Phoenix, you'd typically use their trace decorator or context manager. You'd wrap your research agent function, and it automatically captures the inputs, outputs, and metadata. For LangSmith, you'd use LangChain callbacks. If you're using LangChain to build your agent, you set up a LangSmith callback handler, and it automatically sends trace data to their platform. You can configure it to group traces by session or by run, and you can tag a run as stopping at a specific checkpoint.
And if you're not using a framework, you're rolling your own?
Then you'd use the SDK directly. Most of these platforms have a Python client where you can manually send a trace or an evaluation event. It's more code, but it gives you total control over what's sent. The OpenTelemetry path is the most manual but also the most flexible. You instrument your code with OTel spans for each stage, following the GenAI conventions, and then you can export that telemetry data to a backend of your choice—maybe even a custom one you build.
This feels like it bridges development and production. You set this up to evaluate a change pre-deployment, but once you deploy, the same instrumentation feeds production monitoring.
That's a key insight. The checkpoints you define for evaluation become the telemetry points for monitoring. In production, you're not running LLM judges on every call—that's too expensive. But you are capturing the same checkpoint data. You can aggregate the metadata into dashboards: average latency per stage, token cost per stage, error rates. And you can still run spot evaluations, or trigger an automated evaluation if a metric drifts.
What would a production dashboard for our pipeline look like, based on checkpoint metrics?
You'd have a panel for the grounding stage showing grounding recall score—a measure of what percentage of the necessary facts were retrieved. You'd track hallucination rate per stage, which for a research agent would be facts without valid citations. You'd have latency and cost graphs. For the scriptwriting agent stage, you might track coherence scores or adherence to style guidelines. The dashboard isn't just 'is the pipeline up?' It's 'is each stage performing its specific job well?'
So the implication is that this approach doesn't just make development cheaper. It forces you to define what 'well' means for each component, which in turn makes the whole system more reliable and understandable.
That's the foundational shift. You're building a system with defined interfaces and quality gates between components. It's how you move from a fragile chain of prompts to a robust, engineered application. The tools are just enablers for that discipline.
Right, the tools enable the discipline. But I can hear the listener thinking—this sounds like a lot of upfront work. I'm one person with a messy pipeline. Where do I even start without getting overwhelmed?
You start with one checkpoint. Just one. Pick the stage in your pipeline that is most critical, or the one you're currently trying to improve. For most agentic systems, that's the grounding or retrieval stage. That's where the biggest quality swings happen. Don't try to instrument your entire DAG on day one.
And instrument it with what? Do I need to sign up for a platform immediately?
No. Start with a simple JSON log file. Seriously. Modify your code so that after that stage runs, it writes a file to disk. That file should contain the input prompt, the configuration used, the output artifact, and the basic metadata like token count and latency. That's your checkpoint. You now have a way to capture a snapshot of that stage's work. You can run your pipeline with the old version and the new version, collect the JSON files, and just… look at them. Compare them manually.
That feels almost too simple.
It is simple. But it's the foundational habit. You're isolating a component and capturing its output for evaluation. The fancy platform comes later, when you have hundreds of these runs and you need automated scoring and visualization. Complexity can grow iteratively. The first step is just breaking the 'try-and-see' loop by creating a comparable artifact.
Alright, step one: pick one critical stage and make it log its state. What's the second actionable insight? You hinted at it earlier with stage-specific metrics.
Right. This is where most people go wrong. Your evaluation metric must be specific to the checkpoint's purpose. If you're evaluating the grounding stage, you do not use the final answer quality. That's a downstream metric, and it's polluted by everything that happens after. You need a metric that judges the grounding stage on its own job. Is it retrieving relevant, well-cited context?
So you'd define something like a 'context relevance score' and a 'citation accuracy score' for that stage.
And you can start evaluating that manually, or with a simple script. For a research agent, you might look at the list of facts and ask: For each fact, is there a source? Does the source URL actually contain that fact? How many of the facts are directly relevant to the query? You can score that on a scale of one to five. That's your baseline. The metric is tied to the contract of the stage.
This forces a clarity that most pipelines lack. You have to define what a 'good' output from your research agent actually looks like, separate from the final script.
That's the engineering rigor. It moves you from "I hope this works" to "this component fulfills its defined function to this measurable standard."
So, for our listener who's been nodding along, what's the concrete, do-this-now task?
This week, take thirty minutes and audit your own pipeline. Map it out as a directed acyclic graph, even if it's just boxes on a napkin. Identify the stages. Then pick one—just one—to isolate for your very next A/B test. It could be your retrieval step, your summarization step, your validation agent. The next time you want to change a model or a prompt or an API, don't run the whole pipeline. Run only up to that stage, capture the checkpoint output for a few test inputs, and compare the before and after artifacts. You'll learn more from that than from ten full end-to-end runs.
And that alone will save you compute, time, and sanity.
It turns a black box into a glass box, one component at a time. That's the practical foundation for building systems you can actually understand and improve.
That foundation is crucial. But this whole checkpoint philosophy also raises a bigger, thornier question. What happens when our pipelines aren't just linear DAGs? What about autonomous systems with recursive loops—an agent that can call itself, or a validation step that triggers a re-grounding? How do checkpoint strategies evolve when the execution path isn't predetermined?
That's the frontier. In a recursive or self-correcting system, you can't just define a static checkpoint after 'step three.' The checkpoint has to be state-based or condition-based. You might instrument a checkpoint after every successful grounding operation, regardless of when it occurs in the loop. Or you define a checkpoint around the decision logic itself—capturing the state of the system when it chooses to iterate. The evaluation becomes about the quality of the decision to loop, not just the output of a fixed stage.
So the methodology adapts from checking 'what' to also checking 'why' and 'when.'
Right. And this approach is becoming foundational for the emerging 'LLM Ops' role. It's the bedrock for safely deploying systems that are meant to self-correct. You can't have autonomy without observability. You need these checkpoints to create a flight recorder, so if an agent gets stuck in a loop or makes a poor correction, you can replay the exact state and understand the failure.
It turns pipeline tuning from alchemy into a measurable engineering discipline. You're not just whispering incantations at a prompt and hoping. You're building with gauges and control panels.
That's the final pitch. This isn't just a cost-saving trick. It's the mindset shift required to build robust AI applications that we can actually trust and maintain. Start with one JSON log file. End with a monitored, evaluated, production-grade system.
We've been My Weird Prompts. A huge thank you to our producer, Hilbert Flumingtop, for keeping this whole operation running. And thanks to Modal for providing the serverless GPUs that power our pipeline—and our evaluations.
If you found this useful, leave us a review wherever you listen. It helps others find the show. All our episodes are at myweirdprompts.com.
Until next time.
Bye, everyone.

")