You know, when most people think about satellites, they immediately go to one of two places. It is either the James Bond villain with a giant space laser or a grainy black and white photo of a missile silo that a general is pointing at in a windowless room. The whole spy satellite trope has a real stranglehold on the public imagination. It is all about the zoom and enhance, the secret tasking, and the high-stakes espionage. But today's prompt from Daniel is asking us to look at the other side of that coin. He wants us to explore the massive, often public, and honestly much more interesting world of civilian and scientific remote sensing. It is the stuff that is tracking how fast cities are sinking, where methane is leaking in real time, and how the oceans are breathing.

It is a phenomenal topic because we are living through what I call the golden age of orbital transparency. I am Herman Poppleberry, by the way, and I have been digging into the data specs for some of these new constellations all morning. The reality in two thousand twenty-six is that the most powerful eyes in the sky are not just for the intelligence community anymore. They are public utilities. We have moved from a world of guessing what is happening on the planet to a world of measuring it with incredible precision. The spy satellite trope is effectively dead because the civilian stuff has caught up in ways that are actually more useful for solving global problems. We are not looking for missiles; we are looking for the invisible signatures of a changing planet.
And that shift did not happen by accident. I remember we touched on the orbital mechanics of tasking back in episode fourteen thirty, where we talked about how hard it is to actually point a camera at a specific license plate on short notice. But what we are talking about today is different. This is not about a one-off snapshot. It is about a constant, global pulse of data. When did this actually start becoming a public thing? Because for a long time, this was all highly classified, right? You did not just log onto a website and see the entire Earth in high resolution.
The turning point was really two specific policy shifts that created what we now call the free data revolution. The first was in two thousand eight when the United States Geological Survey, or the U-S-G-S, made the entire Landsat archive free to the public. Before that, you had to pay thousands of dollars for a single image. If you were a researcher wanting to see how a forest changed over ten years, you needed a massive grant just to buy the pictures. Then, in twenty fourteen, the European Space Agency followed suit with the Copernicus program and the Sentinel satellites. That decision changed everything. It meant that a researcher in a basement, a small startup, or even a curious hobbyist could suddenly access petabytes of high-quality data without a massive budget. It democratized the view from space. It turned satellite imagery from a luxury good into a public infrastructure, like roads or the G-P-S signal.
It is basically the open source movement but for the entire planet's surface. But I think the misconception is that these are just fancy cameras. People hear satellite imagery and they think of a photograph, like what you would take with an iPhone but from four hundred miles up. But when you look at the specs for something like the Sentinel constellation, it is not just taking pictures in the way we think of them, is it? It is more like a laboratory in orbit.
Not at all. If you are just looking at visible light, you are missing ninety percent of the story. Take Sentinel-one, for example. It uses Synthetic Aperture Radar, or S-A-R. Unlike a standard camera that needs the sun to illuminate the ground, an S-A-R satellite carries its own light source in the form of microwave pulses. It beams them down and measures how they bounce back. Because those microwaves have a longer wavelength than visible light, they pass right through clouds, smoke, and even heavy rain. It is the ultimate all-weather advantage.
That is huge for disaster response. I was reading about the wildfires we have been seeing lately, and the optical satellites are basically useless because of the smoke plumes. They just see a big grey blur. But the S-A-R sensors can see the actual fire line and the ground deformation right through the thickest smoke. It is like having X-ray vision for the planet.
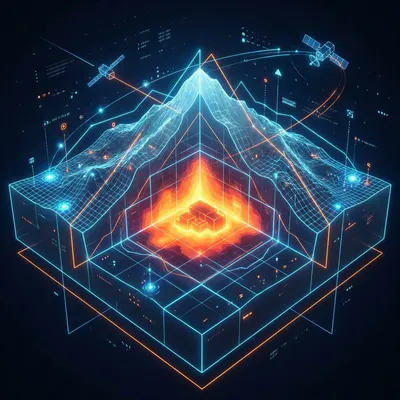
And it goes even deeper than just seeing through clouds. There is a technique called Interferometric Synthetic Aperture Radar, or In-S-A-R. This is where it gets genuinely mind-blowing. By comparing two radar images of the same spot taken at different times and looking at the phase shift of the microwave signal, we can measure ground movement at the millimeter scale. We are talking about detecting the earth breathing from four hundred miles up. If the ground moves even a tiny fraction of an inch between satellite passes, the phase of that returning microwave changes, and we can map that change across entire provinces.
Wait, millimeter scale? You are telling me a satellite can tell if a sidewalk has shifted by the width of a coin from orbit? That sounds like science fiction.
It sounds like it, but it is the standard now. Well, I should say, that is the level of precision we are seeing in the published research. Look at Mexico City. Parts of that city are sinking by up to fifty centimeters per year because they are pumping out the groundwater. Or Jakarta, which was sinking so fast that Indonesia actually started moving its capital city to a different island. We know the exact rates of that subsidence because of Sentinel-one data. It is being used to monitor the structural integrity of dams and bridges too. Instead of just putting a physical sensor on one part of a bridge, you can monitor the entire structure and the ground around it every twelve days. If a dam starts to bulge or settle by a few millimeters, the In-S-A-R data will flag it long before a human inspector sees a crack.
I assume that is why the N-I-S-A-R mission is such a big deal. That is the joint project between N-A-S-A and the Indian Space Research Organisation, right? I have heard it pronounced Nye-sar.
It is. It is one of the largest Earth science collaborations in history. It is launching with dual frequency radar, L-band and S-band. The L-band is the real star here because it can actually penetrate through dense forest canopies to see the ground underneath. Most satellites just see the tops of the trees, but N-I-S-A-R is going to map the entire globe every twelve days. It is going to give us a baseline for how the Earth's crust is moving that we have never had before. It is going to be foundational for earthquake research and volcanic monitoring. We will see the ground inflating before a volcano erupts, even if it is covered in clouds and jungle.
You have been dying to explain the physics of phase shifts, haven't you? I can see the excitement. But let's pivot for a second to the atmosphere. Because it is not just the solid ground we are watching. Daniel's prompt mentioned methane tracking, which has been a huge point of contention lately with corporate accountability. We have all these climate goals, but for a long time, we were just taking a company's word for it when they said they did not have any leaks.
The methane situation is a perfect example of how satellite data is forcing transparency. Methane is a potent greenhouse gas, and it is invisible to the naked eye. Enter Sentinel-five P and its T-R-O-P-O-M-I instrument. It maps atmospheric trace gases like nitrogen dioxide and methane at a resolution of about three point five kilometers every single day. It can spot a massive industrial plume from space and point a finger directly at the source. It is like a global pollution police force that never sleeps.
But we had a bit of a setback recently, didn't we? I heard about Methane-S-A-T losing contact back in June of twenty twenty-five. That was the one funded by the Environmental Defense Fund. It was supposed to be the gold standard for independent monitoring.
It was a massive blow. Methane-S-A-T was designed specifically to find smaller leaks that the bigger government satellites might miss. It was the bridge between the global view and the facility-level view. Losing contact with it was a real tragedy for climate accountability. However, the commercial sector is stepping up in a big way to fill that gap. A Canadian company called G-H-G-Sat has been expanding its fleet rapidly. They are on track to have over sixteen satellites in orbit this year. Their resolution is down to twenty-five meters, and they can detect leaks as small as one hundred kilograms per hour.
It is interesting that the companies are buying the data themselves. I saw that Exxon-Mobil and Saudi Aramco are actually clients of G-H-G-Sat. It is almost like they know they can't hide it anymore, so they might as well be the first to know about it so they can fix it before the U-N or a regulator calls them out.
It removes the plausible deniability. You can't say you didn't know about a leak when there is a time-stamped orbital record of the plume. And we have new missions like Tango-Carbon launching later in twenty twenty-six that will offer three-hundred-meter resolution for both methane and C-O-two. This leads directly into the broader multispectral and hyperspectral revolution. If S-A-R is about shape and movement, multispectral imaging is about chemistry. It is about seeing what things are made of.
Right, because different materials reflect light in different ways across the spectrum. Most people know about infrared for heat, but it goes way beyond that. I have seen those maps where the forests look bright red or neon green.
That is usually the "Red Edge," which is a specific part of the spectrum that is very sensitive to chlorophyll. Think about agriculture. We have the Harmonized Landsat and Sentinel-two product now, which everyone just calls H-L-S. It is a brilliant collaboration between N-A-S-A and the E-S-A. They have combined the data from Landsat eight and nine with Sentinel-two A, B, and the new C model that launched in twenty twenty-four. Because they have harmonized the data—meaning they have adjusted for the slight differences in the sensors—a farmer or an analyst can get a thirty-meter resolution view of any spot on the planet every one point six days.
That is almost every other day. That is a huge jump from the old days where you might get a clear shot once every two weeks if you were lucky and it wasn't cloudy. That is enough to actually manage a crop in real time.
It is a game changer for precision agriculture. You can see crop stress before it is even visible to the human eye. You can see changes in chlorophyll content or water stress in the leaves. That allows for precision fertilizer application. Instead of blanketing a whole field with nitrogen, which is expensive and bad for the environment, you only put it where the satellite says the plants are struggling. It saves money and reduces runoff into the water supply. The hyperspectral agriculture market is projected to cross four hundred million dollars this year because the R-O-I is just so obvious.
And speaking of water, I wanted to ask you about that new N-A-S-A P-A-C-E satellite. I remember you mentioning it when it launched in twenty twenty-four. How is that different from the older ocean color sensors we have had for years? I thought we already knew the ocean was blue.
P-A-C-E is a total shift in how we see the water. It is hyperspectral, which is the next level up from multispectral. Most satellites look at maybe ten or twenty broad bands of light. P-A-C-E's Ocean Color Instrument looks at over two hundred very narrow bands. It is like the difference between seeing five shades of blue and seeing every possible graduation of color in the ocean. It is the difference between a four-color crayon box and a massive professional paint set.
And what does that actually tell us? Is it just about the health of the water, or is there a commercial angle there too?
It allows us to identify specific species of phytoplankton. That is huge. Phytoplankton produce about half of the oxygen we breathe and they are the base of the food chain for all fisheries. Some species are great for the environment, while others create harmful algal blooms that can kill off fish and shut down beaches. With P-A-C-E, we can distinguish between the two from space. We can predict a toxic bloom before it even reaches the coast, giving fisheries and tourism boards time to react. It is also helping us understand the carbon cycle in a much more granular way, because different types of plankton sequester carbon differently.
It is wild to think about how much we have ignored the oceans just because they are so vast and hard to sample by boat. But let's shift to something a bit more human-centric. Nighttime lights. I have always loved those "Earth at Night" photos, but apparently, they are becoming a serious economic tool now. They aren't just for desktop wallpapers anymore.
They are essentially a real-time proxy for G-D-P. We have the V-I-I-R-S sensor on the Suomi N-P-P and N-O-A-A polar-orbiting satellites. It has a "Day-Night Band" that is sensitive enough to see a single street light or a fishing boat from space. In twenty twenty-five, a new high-definition nighttime light dataset, or H-D-N-T-L, was released that covers over six hundred cities with data going back to twenty twelve. Researchers are using it to track things that governments might try to hide or misreport.
Like what? Economic sanctions or conflict zones?
Specifically that. You can see the lights dimming in North Korea compared to South Korea, obviously, but you can also see the impact of conflict in places like Ukraine or Syria. When a city goes dark, you can measure the exact scale of the displacement and the loss of economic activity. On the flip side, you can see the expansion of the electrical grid in sub-Saharan Africa. It is a way to verify economic growth without relying on official government numbers, which can be, shall we say, imaginative in some parts of the world. N-A-S-A's Black Marble product provides these daily composites that are free for anyone to download.
It is the ultimate "check your work" for global economics. I also saw that it is being used to track the transition to L-E-D lighting. Apparently, L-E-Ds look different from space than the old high-pressure sodium lamps.
They do. L-E-Ds have a much higher blue light component. This is actually a concern for light pollution and human health, and we can map that shift globally now. It is another example of how a sensor designed for one thing—weather monitoring in this case—becomes a tool for urban planning and public health. We are seeing the transition to L-E-Ds happening in real time across the globe, and we can measure the impact on the night sky.
Speaking of weather and rapid response, we have to mention the fire tracking. I was looking at the N-A-S-A F-I-R-M-S website the other day. The latency on that is incredible. It felt like I was watching the planet in real time.
It is borderline real-time. The Fire Information for Resource Management System, or F-I-R-M-S, now delivers M-O-D-I-S active fire detections with about twenty-five seconds of latency. V-I-I-R-S is around fifty seconds. Think about that. Within a minute of a satellite passing over a spot on Earth and detecting a thermal anomaly, that data is processed and available on a public map. It is used by firefighters to see where a blaze is jumping containment lines in the middle of the night when they can't get planes in the air. It is one of the most direct applications of "space to ground" utility we have.
That is a massive public service. And it is all free. That is the part that still gets me. The amount of money it costs to build, launch, and operate these things is in the billions, and yet I can go to a website and see the fire line for free. Why is that?
It is a deliberate choice to treat this data as a public good. The economic return on making this data free is estimated to be billions of dollars more than what could be made by selling it. It fuels the entire commercial space sector. Companies like Planet Labs take this free data and layer their own high-resolution imagery on top of it. Planet has over two hundred "Dove" satellites that provide daily three-to-five-meter resolution imagery of the entire Earth's landmass. They sell that to customers, but the foundation of the whole industry is the free, calibrated data from N-A-S-A and the E-S-A.
And the future looks even more detailed. We have Landsat Next coming in the early twenty-thirties. I saw the budget was restructured recently to make it more affordable, but the specs are still insane.
They are. Right now, Landsat nine has eleven spectral bands. Landsat Next is going to have twenty-six. It is going to be able to see things like water quality parameters and surface temperature with a level of detail that we can't even process yet. It is moving us closer to a "digital twin" of the Earth where every pixel tells a story about the chemistry and physics of that specific spot.
You mentioned processing, and I think that is the real bottleneck now, right? It is not about getting the data; it is about knowing what to do with it. If you are a listener and you are interested in this, where do you even start? It feels like you need a supercomputer just to open one of these files.
That is the "Data Literacy" gap. The bottleneck is no longer the "where" or the "how much," but the "so what." If you want to see the raw power of these tools, go to the U-S-G-S EarthExplorer or the N-A-S-A Earthdata portal. If you want something more user-friendly, the Copernicus Open Access Hub is great for the European data. But for most people, platforms like Google Earth Engine are the way to go. They have already done the heavy lifting of ingesting the petabytes of data. You can write a few lines of code and see how a lake has shrunk over thirty years or how a city has expanded.
And for the fire stuff, it is just F-I-R-M-S dot modaps dot eosdis dot nasa dot gov. It is a mouthful, but if you just search for N-A-S-A F-I-R-M-S, it will come up. It is a great way to see the sheer scale of global activity, from agricultural burning in Africa to forest fires in the Amazon. It really puts the "global" in global warming into perspective.
My takeaway for people is that we are moving away from a world of "sampling." We used to send a guy out to a field to measure a few plants, or a boat out to the middle of the ocean to drop a bucket. Now, we are measuring the whole thing, all the time. The challenge for the next decade isn't going to be getting more eyes in the sky; it's going to be developing the A-I and automation to make sense of the data flowing down every hour. We are drinking from a firehose of planetary information.
It's a shift from "where is the data" to "what is the data telling us." I think the ethical tension here is going to be interesting too. As this data becomes more granular, the line between "scientific monitoring" and "private surveillance" might start to get a bit blurry. If a satellite can see a methane leak on a specific ranch, or a change in crop yield for a specific farm, that is sensitive information. It could affect land prices or insurance premiums.
It is a valid concern. But I would argue that the public benefit of knowing about a massive methane leak or a failing dam far outweighs the privacy concerns of a corporation. We are moving toward a world of radical transparency. You can't hide your environmental impact when the atmosphere itself is being mapped every day. It changes the social contract. If you are a bad actor, the sky is no longer the limit—it is the witness.
It's a brave new world, or at least a much more transparent one. I think we should leave it there for today. This has been a great dive into the "boring" satellites that are actually doing the most important work. They might not have lasers, but they have the truth, which is probably more dangerous to a villain anyway.
They are only boring if you don't like knowing how the world actually works, Corn. To me, a millimeter of ground displacement is more exciting than any Hollywood explosion.
Fair point. Thanks as always to our producer, Hilbert Flumingtop, for keeping the show running smoothly and making sure our audio doesn't have any phase shifts.
And a big thanks to Modal for providing the G-P-U credits that power our research and the generation of this show.
This has been My Weird Prompts. If you are enjoying the show, a quick review on your favorite podcast app really helps us get the word out to new listeners. It is the best way to support the show.
You can also find our full archive and all the links to the data sources we mentioned today at myweirdprompts dot com. Go explore the Earth for yourself.
We will catch you in the next one.
See you then.
")